


The Weekend Rebel Review for July 29-30
A week of charting

This is just some thoughts, it isn't investment advice or incitement to buy in any way, just my views - please do your own thorough research. I’m not an analyst, I’m just a private investor looking after my own money. Nothing I do or say is meant as advice or should be taken as such. Here I publish my ideas and research that I have done and discuss the way I invest. Anything written here needs to be verified for its accuracy. Assume any stock I write about I likely own, so my views are biased. Inevitably I will get things wrong, Everyone is responsible for their own decision making and what they buy and sell. Subscribing and reading this article means you accept the above and you take full responsibility for your own actions and decisions. Small Cap stocks can be illiquid and very hard to sell at times when demand is weak so caution is required.
Subscribe for free here:
Well that is July out of the way more or less, often the dullest month going, with so many people taking the kids on holiday, summer distractions like Wimbledon, Ascot, Cricket etc and in recent years it seems that directors only work weekdays and if they have an ‘S’ in the day. All of this makes the market dull from lack of news and momentum. I find myself nodding off at the screen, woke up the other afternoon with QWERTY embossed in my forehead. Got the new lift on the truck so that was the good news.
Charts interest me. I have heard lots of investors say they aren’t interested in charts, like they are some sort of hocus pocus voodoo method of investing but really they are just one tool to help you time an investment. The old saying goes ‘it isn’t timing the market, it’s time in the market, but actually it is both. If you had bought the FTSE 250 six years ago you are down on your investment. If you had bought it 18 months later you are up 10%. So I thought I would run though a few charts. I use charts purely for trend. I’m not interested in Fibonacci scales or Elliott Waves, you can make most cases fit most charts on these basis imo, it’s like Old Moore’s Almanac or Notradamus . Trends show up in charts for a reason. They are an homogenisation of the knowledge in the market and the action being taken by investors and drawn graphically – the human brain usually finds graphics much easier to process than lots of numbers.
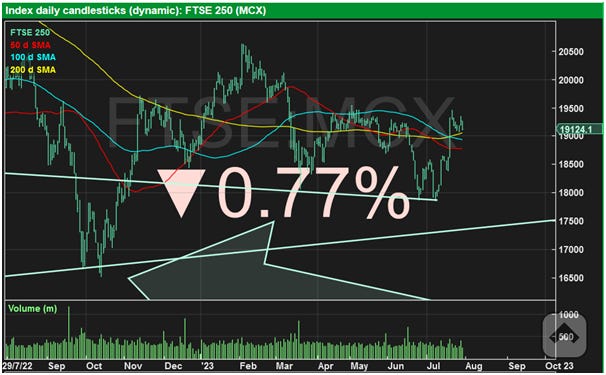
Here is the FTSE250 over 2 years and it clearly shows the selling momentum declining and the October capitulation when punters panicked and sold the mkt down 5-6% before the market rebounded to be up around 2% at the close.

I went into that October capitulation fully invested, mainly in consumer stocks as that reduced rate of fall was already in the chart. At 1.30pm, when the US inflation figs came out and the market fell around 5% I did think I might have made a grave mistake but the intraday reversal just confirmed that was a capitulation and gave me even more confidence. The thing is the trend was there and you have to take notice imo.
A month ago I posted this on Twitter

Here is the same chart as above but zoomed in, the chart hit that trend line and bounced. It subsequently hit the same line and bounced again which again made me feel the market was saying this was a higher low from the big low in October
The tough thing is we are in the summer. In most normal times you are getting lots of trading updates and news which helps confirm that the trends that stock charts are showing are correct and they reinforce investor sentiment. During this summer there has been a drought of news. The market has been fixated with inflation and interest rates (when the BBC can stop going on about global warming anyway). Companies may put out trading updates but investors and traders have been ignoring it because they believe high inflation and higher interest rates will destroy any growth. As much as they believe that the numbers keep on saying growth is better than expected, especially in the US. There is also the expectation that rates will have to go even higher to slow growth to reduce inflation – but will they?
The one thing that confounded the ‘experts’ after the financial crisis was how low inflation stayed. Remember interest rates were reduced to zero and ‘Helicopter Ben’ was printing money as fast as the US could make paper, that was an absolute text book method to create hyper inflation but it never happened. How much of that was down to computer algo’s that scour the earth for the best prices these days and act as a huge downward pressure on inflation? And if we now have more and more AI will that not be the next big foot on rising inflation? I don’t know what bears down on inflation these days, all I know is ‘experts like G.Sachs and City Group were screaming that inflation in the UK would hit 18%-22% and it never got anywhere near it. I say this because the market is a crowd in action. If you are in a cinema and someone shouts ‘FIRE!’, everyone dashes for the exit. Another thing I have noticed over time is that one ‘expert’ makes a claim then a few follow and then momentum increases to a point where even sensible people who know this expert is probably wrong, start going along with it because so many others are and it’s ‘safer’ to be part of a crowd as far as reputation goes than stand up on your own and say ‘hold on a minute – I think the world may be round!’
Investing for me is much the same, I don’t want to be part of the crowd because crowds are too often wrong, definitely more than 50% of the time. What happens when the crowd changes its mind? How are you positioned? High in cash? 4% locked in longer term rates in a building society of 5% in gilts? Being there may seem ‘risk-free’ but there is’ opportunity risk’, ie, being locked into 4% when the market is rocketing and yields are at 5-6% or higher and you aren’t able to take advantage.
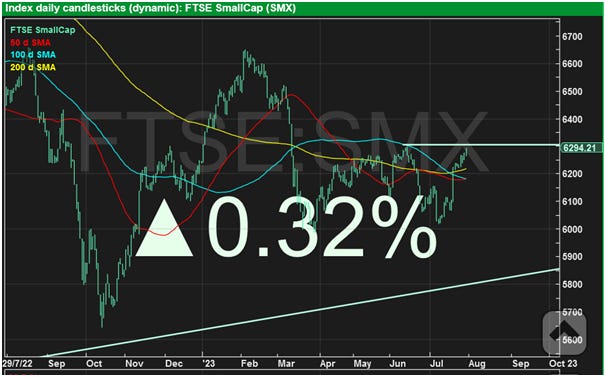
Other interesting charts currently are the UK Small Cap Index (SMX). This is on the crest of breaking the recent highs
Contrast this to the Aim Indexes which are lacklustre. Too much dross has got onto Aim in recent years and it is very hard to sort out genuine companies. I avoid most Aim stuff at the moment as the odds are stacked against you imo. If you get one right the chances are you get two wrong. That is of course until the maniacs return and drive everything on Aim up and in that sort of market I would trade a bit of momentum in there.
The Dow Transport is another really interesting index, setting up to make a major break out to new all time highs. If that happens I expect the US market to really take off and that would likely pull other markets higher in my opinion

The last index I would highlight is the DAX (German Index) which has hit a new high this week despite all the energy and lack of interest in EVs. The French CAC hit new highs in April

Over the long term the CAC, DAX and FTSE 250 tend to pretty much track each other north so with the three overlaid together you can see that the FTSE250 could be mighty cheap here (or DAX and CAC could be over valued I guess). Post Brexit sentiment? With the UK growing and Germany in recession then perhaps a few decent UK results may start to correct the FTSE250 weakness?

All in all, these indexes leave me feeling bullish, but then I am a perma-bull I am told so best you draw your own conclusions. There is no UK major data this week but Friday is the first Friday of the month so US non-farm payroll will be out, that may determine the direction for August.
Interesting stuff that caught my eye this week
The bowls on AML and OCDO

AML Aston Martin

OCDO Ocado Group
Both OCDO and AML look like bid targets to me, OCDO for the likes of Amazon while AML would be a great trophy asset for a big card dealer or a Middle East money pit in my opinion.
Rolls Royce RR. put out an absolutely stunning trading update on Weds.
· “Full year guidance raised: we now expect underlying operating profit of £1.2bn-£1.4bn (consensus: £934m) and free cash flow of £0.9bn-£1.0bn (consensus: £732m) in 2023, helped by early transformation benefits”
This was after nearly doubling H1 operating profit guidance from £340m-£360m to £660m-£680m. So having boosted H1 by an ave of £320m they guided the full year higher by an ave of £365m. That seems a low guide for the full year after an H1 that good and I suspect there will be more upgrades going fwd. Broker EPS consensus raised from 4.9p to 5.6p for this year, just over 10%, nonsense in my opinion, I feel they need raising much higher. The interims are on Thurs (3rd) this week, I expect large upgrades after then myself. The shares reacted big but nowhere near big enough in my view so I have been buying.
GAW update was decent in my opinion
SPEC update ok but not as good as I would have hoped so a watch and wait for me.
Not much else to set my heart racing this week.
This week I’ll be looking out for
GRG on 1st, interims
XPP on 1st, interims
RR. on 3rd, interims
MER on 3rd, interims
MGSN on 3rd interims
WIZZ ON 3RD, Q1 update
PETS on 3rd, trading update.
GYM on 4th, interims
CARD and XAR trading updates likely this week
I will be watching closely for index firming and breaking out and stocks starting to get firmer and more positive.
Have a good weekend and a good week ahead
Rebel
another good read. negative is, another 7 days before the next weekend review drops lol
Thanks as always for the content Rich 👍